Aviation data has become increasingly more accessible to the public thanks to the adoptionof technologies such as Automatic Dependent Surveillance-Broadcast (ADS-B) and Mode S, which provide aircraft information over publicly accessible radio channels. Furthermore, the OpenSky Network provides multiple public resources to access such air traffic data from a large network of ADS-B receivers.
This motivated us to develop openSkies, the first R package for processing public air traffic data. The package provides an interface to the OpenSky Network resources, standardized data structures to represent the different entities involved in air traffic data and functionalities to analyze and visualize such data. Furthermore, the portability of the implemented data structures makes openSkies easily reusable by other packages, therefore laying the foundation of aviation data engineering in R.
The following figure shows an example of flight path visualization with openSkies:
One example of provided data analytics is the clustering of flight paths. By clustering these according to their features (mainly, pairs of coordinates), typical routes can be identified automatically. The following figure shows an example of such clustering:
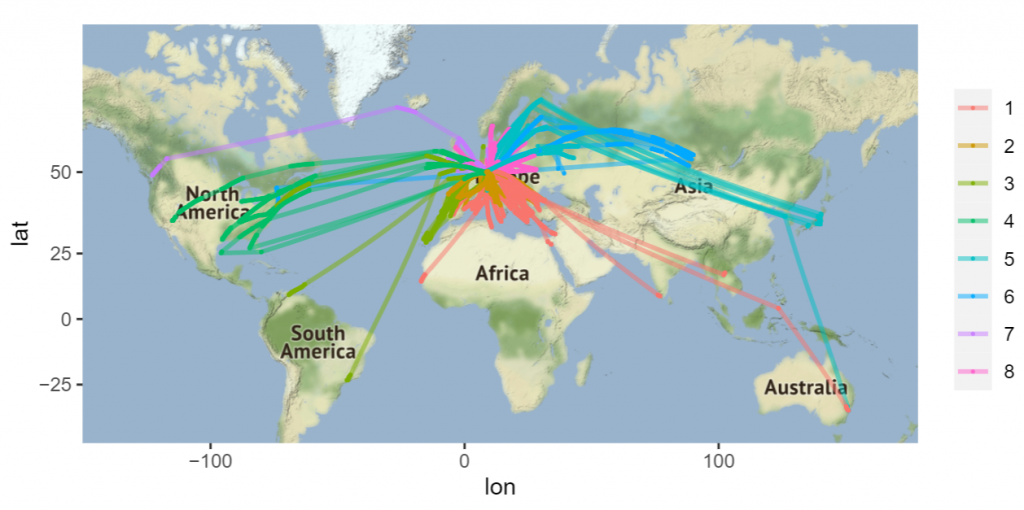
The clusters differ in their broad area of destination. For example, clusters 4, 5 and 6 comprise mostly flights to North America, Japan and central Asia respectively.
Check the available documentation about openSkies here
Check openSkies’ source code here
Related Articles
2021
openSkies-Integration of Aviation Data into the R Ecosystem. Journal Article
In: R Journal, vol. 13, no. 2, pp. 485, 2021, ISSN: 2073-4859.